

Resolving Power
What is Resolving Power?
This software measurement tool has been developed in close connection to the standard DIN 18740-8 ”Photogrammetric products – Part 8: Requirements for image quality (quality of optical remote sensing data)”. It delivers reliable and objectively obtained spatial resolution parameters and is able to validate and quantify many measurement influences and certainties. For more information please refer to Determination and Improvement of Spatial Resolution
Table of content
- General information
- Download
- Test pattern template
- Calculating size of the star
- Arrange toolbars
- Load images
- Adjust brightness
- Perform measurement
- Center determination (Line segment detector)
- Center determination (Phase shift)
- Dense Measurement
- Auto-refinement
- Result (Interpretation)
- Protocol
- External color reference patterns
- Tooltips
- Hotkeys
General information
Almost all of the following sections also have a video to showcase the actual issue. You can watch them full screen in your browser. Just right-click on the video and select "Full Screen". Exit full screen mode at any time by pressing "ESC".
Download
Resolving Power can be downloaded here. It is a free software tool hosted by "German Society for Photogrammetry, Remote Sensing and Geoinformation" (DGPF) developed and maintained by "German Aerospace Center" (DLR).
Test pattern template
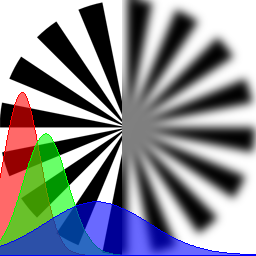
This tool works for images showing Siemens-stars. If you do not have images with a Siemens-star you can find an example here. To include a Siemens-star test pattern in your next flight- or measurement-campaign you can download a scalable vector graphic template of a star here or here and have it print out.


Calculating size of the star
It is very important that the star is large enough to measure spatial resolution. In order to find the appropriate size for your project use the following formulas to calculate star radius:
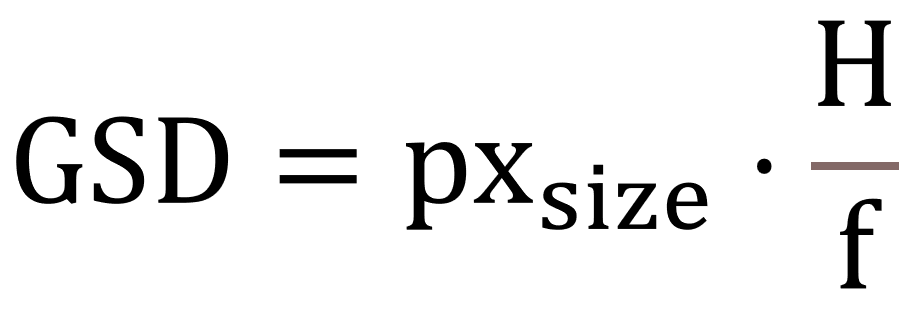
GSD stands for ground sample distance and is calculated from sensor pixel size (px_size), flight altitude above ground or distance to target (H) and focal length of the camera (f). Please note that pixel size is usually given in micrometer, focal length in millimeter and distance to target in meter or kilometer (sometimes even in feet or miles). Therefore, it is crucial to convert the units accordingly!
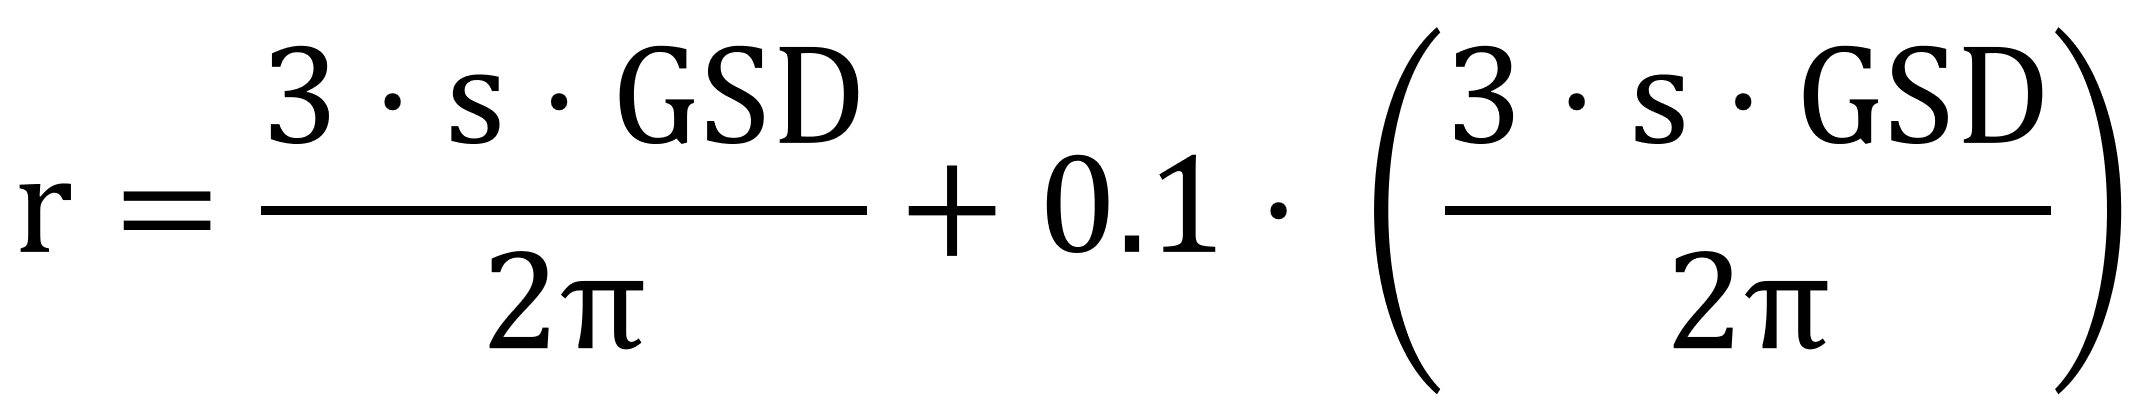
Radius r is then calculated with GSD and the number of the star segments (e.g. s = 16 if there are 8 black and 8 white segments). The second part of the formula adds a 10% certainty buffer.
Arrange toolbars
In case you never used the tool before, you will find some options to customize appearance in the video below. You can arrange most toolbars and widgets to your liking to ensure every item is visible. The results can be exported but will also be prompted in the log-window, so don't forget to activate it (-> Window -> Logs).
Load images
Images can be loaded either by "drag 'n' drop", via "open dialog" or from "recent file list".
Adjust brightness
For a better localisation of the test patterns, brightness and gamma factor can be adjusted. This feature is for convenience only and does not affect the measurement.
Perform measurement
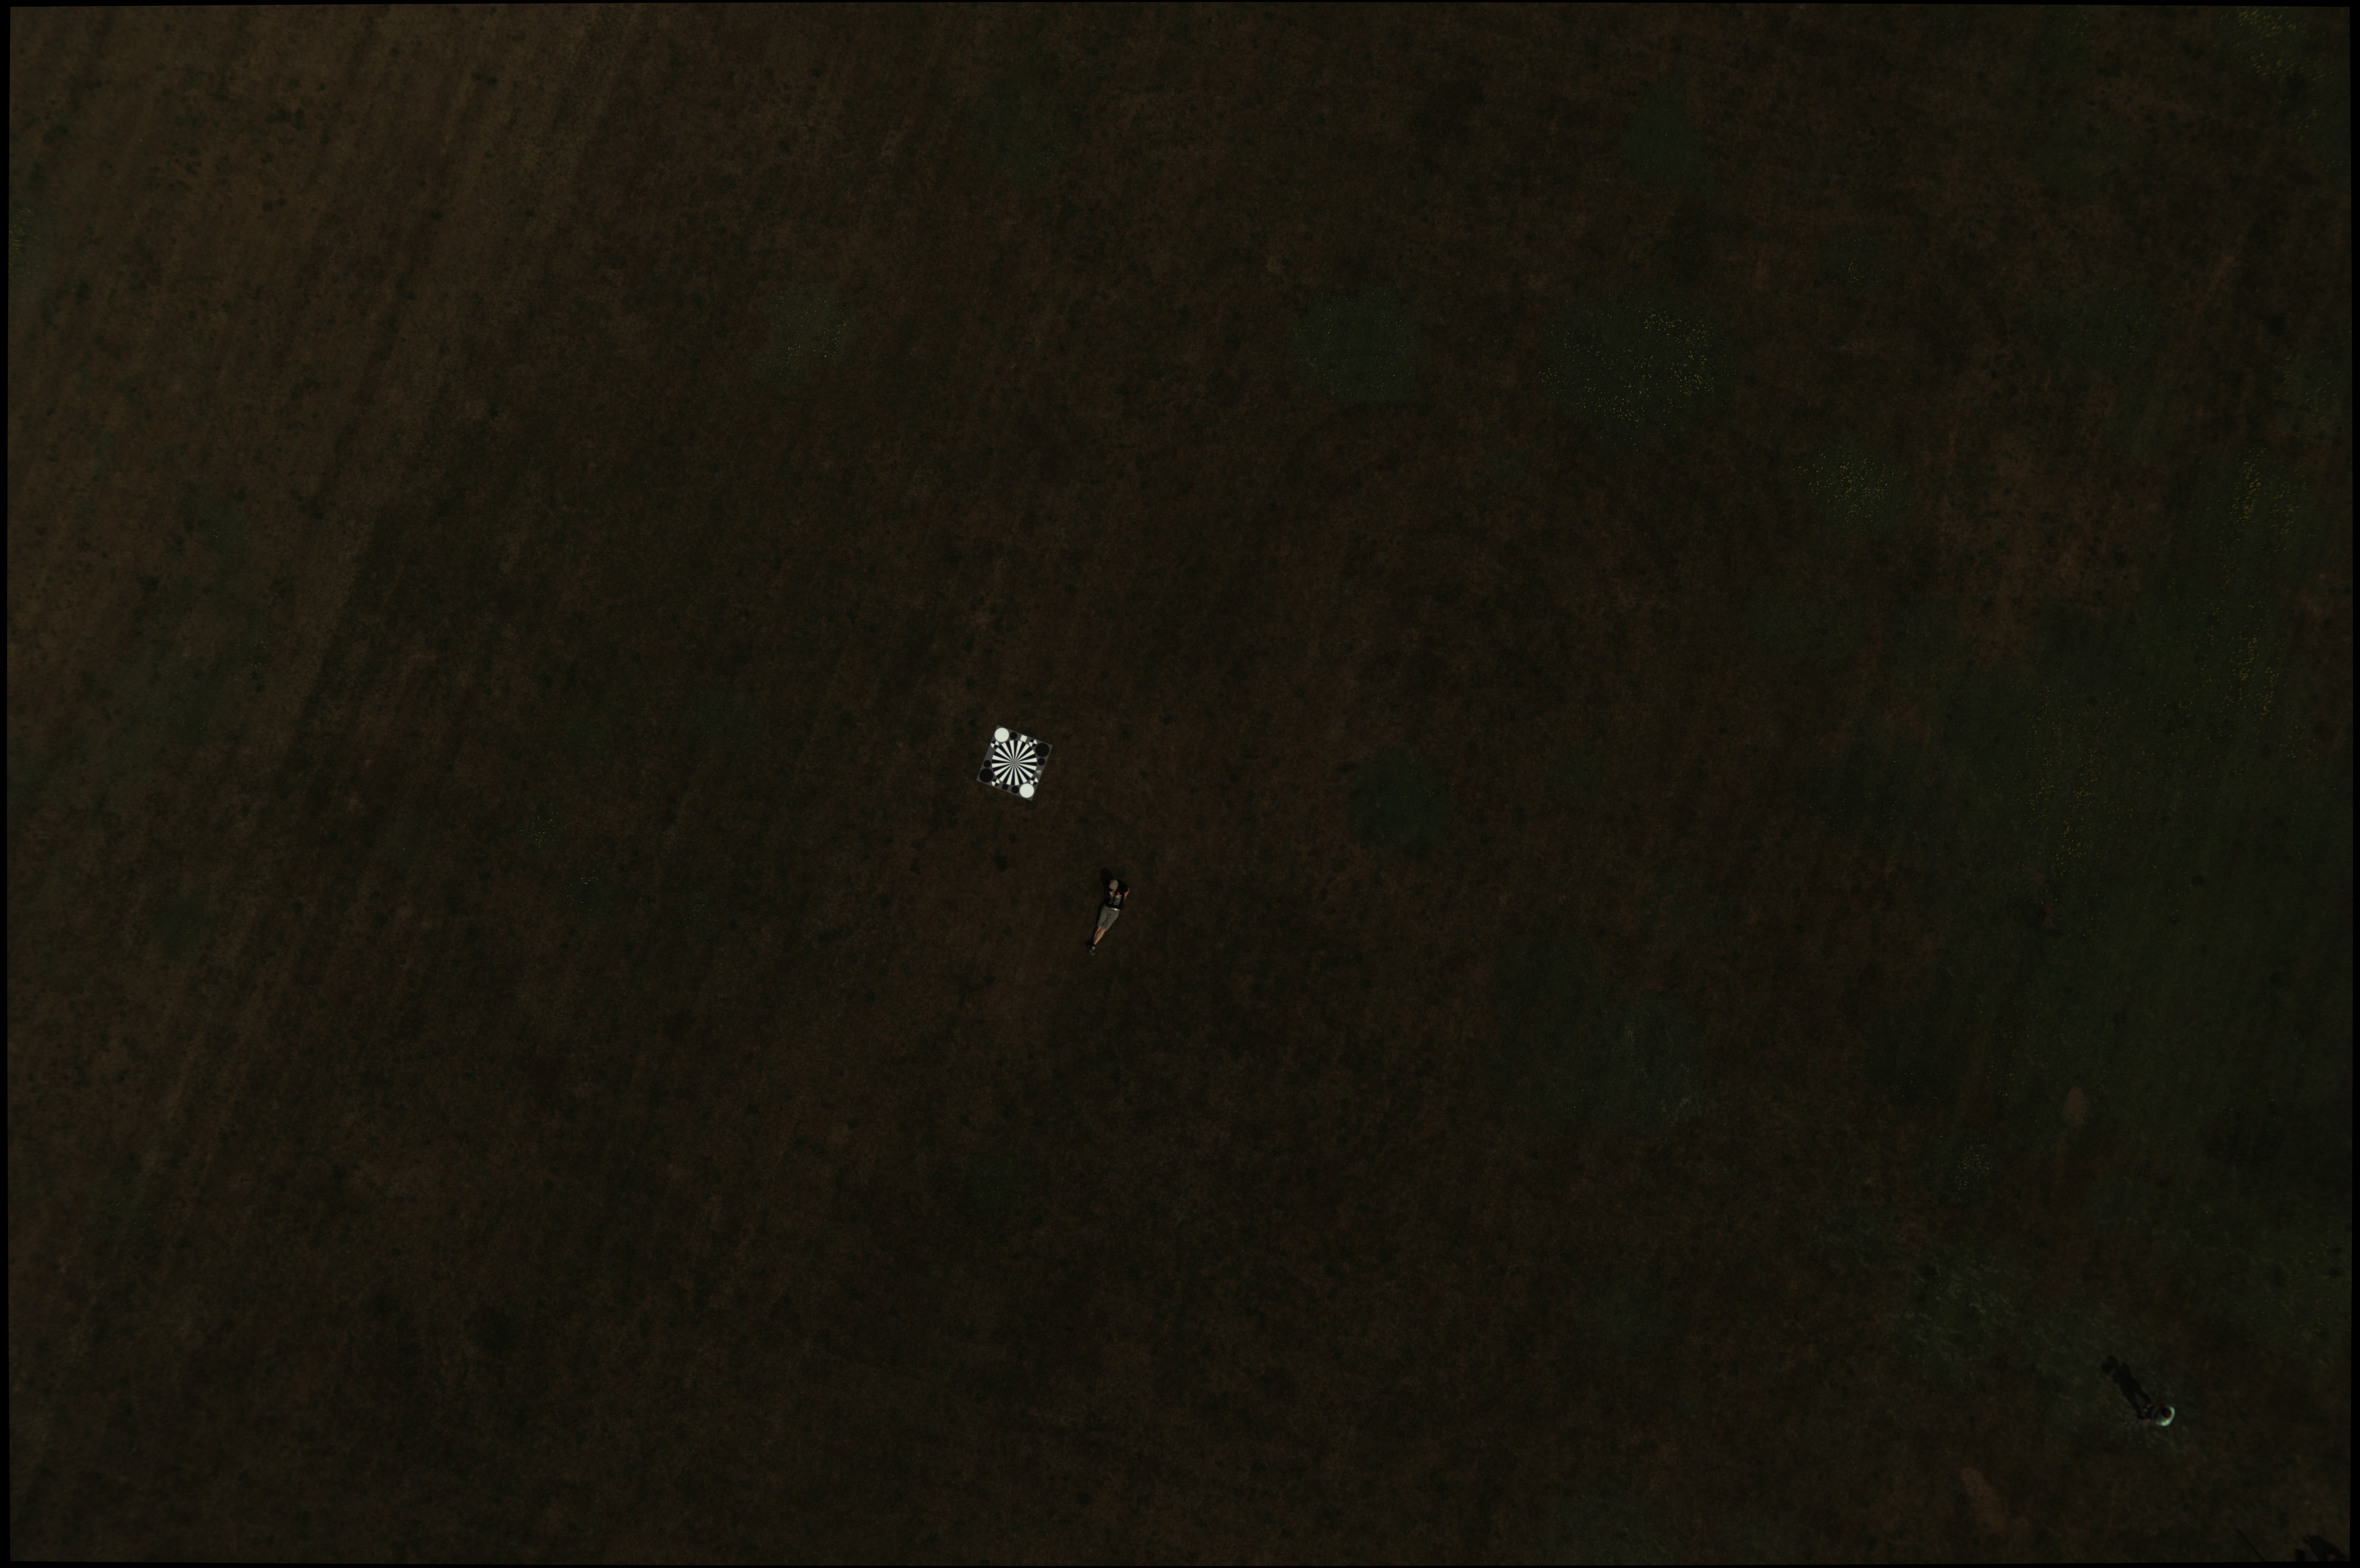
The measurement itself is implemented as a one-click solution. Use "CTRL" + left mouse button at estimated center postion.
Center determination (Line segment detector)
The center position should be refined. This procedure uses extracted lines of the Siemens-star to improve center coordinates. Simply press "o" on your keyboard after the initial measurement (see Perform measurement).
Center determination (Phase shift)
The center position should be refined. This procedure uses signal phase shift to improve center coordinates.
Dense Measurement
When the Siemens-star has been initialized we strongly recommend to perform a dense measurement. This can be done by setting the radius step-width bewtween circles to well below 1 pixel (see video below). The resulting ring-plot (visualization) is slightly shifted but all scans have been performed correctly and the cutoff frequency (MTF10) has been determined as precise as possible.
Auto-refinement
Aformentioned tasks, (a) center determination with line segments (b) further center refinement with phase-shift approach and (c) dense measurement can be done automatically if and when the star is initialized roughly. Just press "a" on your keyboard and all tasks will be executed consecutively.
Result (Interpretation)
The result can be found in the log-window and in the top toolbar. If you're just interested in actual spatial resulution of your image then type in your calculated ground sample distance - GSD (see section about Siemens star calculations) and the actual spatial resolution (GRD - ground resolved distance) will be displayed right next to GSD. In the log window you will find more information e.g. cutoff frequency (MTF10) and the reciprocal as mean value of all channels or separated by Red-|Green-|Blue-channel.
Protocol
A protocol can be exported (including all plots). Click the export icon and select a folder. If you have not performed a dense measurement (the radius step-width is larger than 0.1 pixel) the program will ask you if it should perform a dense measurement for you before exporting the results.
External color reference patterns
If the outermost ring does not contain pure black and white values it is strongly advised to use external color reference patterns if available. The first left-mouse-click (while holding CTRL+ALT) should be on white the second on black. Size of the pattern can be adjusted with button "Size ext. norm". If you want to update the pattern position just restart on white panel then black (see video). To apply external norm factor press button "Ext norm".
Tooltips
Almost every GUI-item (GUI - Graphical User Interface) has a tooltip. Shortly hover over the item and the tooltip will appear.
Hotkeys
The programm will list hotkeys and other useful tips by pressing "F1". There is also a link to this online documentation website in case you need to revisit some of the explanation.
| Description | Hotkey |
|---|---|
| Center refinement (star edges) | o |
| Perform auto-refinement | a |
| Export protocol to folder | x |
| Toggle red channel | 1 |
| Toggle green channel | 2 |
| Toggle blue channel | 3 |
| Toggle wireframe CenterPhase 2D and CenterMTF 2D | w |
| Toggle wireframe MTF 2D | e |
If you want to inspect every circle / ring and every channel separately toggle desired channel(s) and cycle through circles by holding SHIFT and using arrow keys 'left' and 'right'. (see video below)
Imprint / Credits
Deutsches Zentrum fuer Luft- und Raumfahrt e. V.
German Aerospace Center (DLR)
Institute of Optical Sensors Systems
Dept. Security Research and Applications
Rutherfordstraße 2
12489 Berlin
Germany
Phone: +49 30 67055-540
Mail: macs@dlr.de
Home: https://www.dlr.de/os